Maximizing 2D Explainer Video ROI with smart budgeting, design, and execution. Learn strategies to create cost-effective, high-converting explainer videos.

The State of Visual Marketing in 2023: Entering a New Era-facts, stats & trends of visual content marketing
A survey report based on the interview of 378 present-day digital marketers!
“There is no doubt that visual marketing is on the rise. With the advent of platforms like Instagram and Pinterest, which are purely visual in nature, it’s evident that people are increasingly interested in consuming visual content. And as we know, a picture is worth a thousand words. This means that visual marketing has the potential to be much more impactful and engaging than other forms of marketing, which is why it’s so important for businesses to focus on this area in the coming years.”
This report is compiled and owned by Infobrandz.
What’s included in the report:

Major Areas of Marketing Where Visual Content is Leading!

What Types of Visual Content were Mainly Used in 2022?

Which Business Verticals Use Visual Content The Most?

How Much Time Brands Invested in a Week For Producing Visual Content?

What Key Business Challenges Does Visual Marketing Solve?

Budget Wise Segregation of Visual Content!

What are the biggest struggles faced by brands in creating visual content?

Best Performing Channels for Visual Content Marketing!

About Infobrandz’s “The state of visual marketing in 2023” report
Major Areas of Marketing Where Visual Content is Leading!
Our research showed that every division of a company uses visual content for marketing. It is primarily crucial to marketing areas like content marketing, product marketing, and social media marketing, in particular.

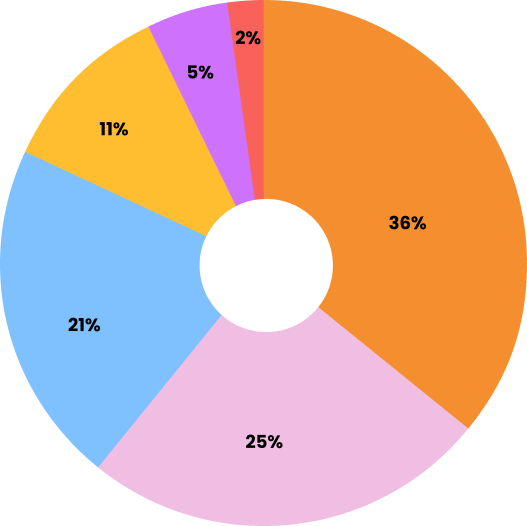
Conclusion – Based on the collected data from the interviews, visual content is used by 36% of product marketers and 25% of content marketers to achieve part of their objectives. Additionally, 21% of social media marketers use visual content to its full potential in their daily tasks.
Conversely, lead generation and brand awareness are the divisions that use visual content the least. Only 2% of lead generation specialists regularly use visual elements in their work. Brands awareness specialists use visual content at a somewhat higher rate than that (5%).
What Types of Visual Content were Mainly Used in 2022?
In 2022, the types of visual content that were mainly used were images, videos, and infographics. These three types of visual content were used because they are able to engage audiences and convey information in a more effective way than text alone. Images and videos are especially effective at grabbing attention and holding it, which is important in a world where people are constantly bombarded with information. Infographics are also effective at conveying complex information in a more digestible format.

Conclusion – Based on the collected data, it’s proven that infographics and branded illustrations are still the most used visual content. Videos and presentations also made their essential marks. Charts and data visualizations are also crucial as graphic elements. Document-type visual content is at the bottom of this list.
Which Business Verticals Use Visual Content The Most?
Visual content is used extensively across many industries, not just within the technology sector. Its popularity is due to its ability to capture and communicate information quickly and effectively. Additionally, visual content is often more memorable than textual content, making it a valuable tool for marketing and advertising.
Conclusion – The ecommerce and retail industries are home to 35% of marketers who regularly employ graphics in their campaigns. The software and internet sectors came second and third, respectively, with 19% and 18%.Human resources (5%), finance (7%), and healthcare (6%) are the industries that employ visual material the least.
Additionally, we observe an increase in the use of visual material in industries like agriculture, shipping, consulting, real estate, education, and corporate communications.
How Much Time Brands Invested in a Week For Producing Visual Content?
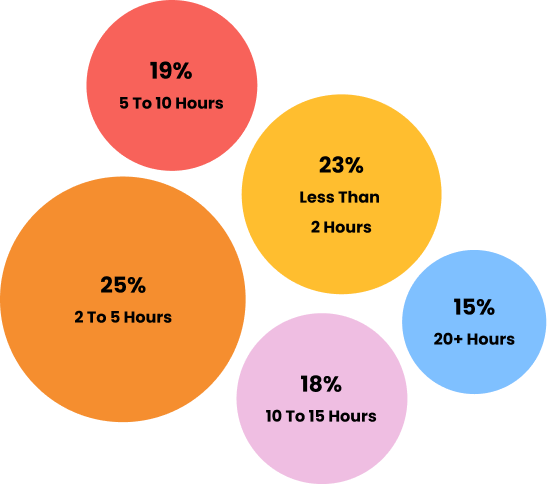
The average brand spends approximately 5-6 hours per week producing visual content. This includes time spent crafting visuals, such as images and videos, as well as time spent promoting this content across social media platforms. The amount of time required to produce visual content can vary depending on the size and scope of the project but typically falls within this range.

Conclusion – Based on the accumulated data from the interviews, it’s not clear what are the chief factors behind visual content creation. It depends on several factors, including the brand’s goals, target audience, and resources. However, brands should be aware that creating visual content can be time-consuming and requires significant investment. To maximize the return on investment, brands should carefully consider their goals and objectives before embarking on a visual content strategy.
What Key Business Challenges Does Visual Marketing Solve?
There are a few key business challenges that visual marketing can help solve. Firstly, it can help to increase brand awareness and recall. Secondly, visual marketing can help to improve customer engagement and conversions. Thirdly, visual marketing can assist in creating a more consistent brand image and message across all channels. Lastly, it can help to reduce advertising costs by increasing the effectiveness of campaigns. All of these factors contribute to making visual marketing a powerful tool for businesses of all sizes.

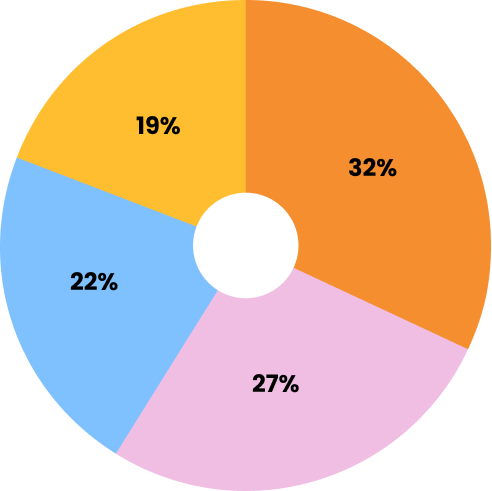
32%
Customer
Acquisition

22%
Product
Experience

21%
Brand
Awareness &
Visibility

14%
Brand
Innovation
11%
Others
Conclusion – 30% of marketers claim that producing videos is their attempt to address the issue of consumer acquisition. For the same question, 24% of them stated that they have expertise and understanding of the product, and 20% said they are trying to fix the problem of awareness and visibility.
It’s interesting to note that 16% of marketers offered original justifications for their need for innovation, arguing that doing so will help them earn more business by capturing the attention of their target audience.
Budget Wise Segregation of Visual Content!
Generally speaking, brands tend to invest a significant amount of their budget into creating visual content. This is because visuals are often more effective than text in catching consumers’ attention and conveying information. Additionally, visuals are also more shareable than text, which can help brands increase their reach and engagement.
 10% of brands invest in stock photography
 13% of brands invest in animation
 24% of brands invest in creating videos
 26% of brands invest in tools & software for creating visual content
 27% of brands invest in designing
Conclusion – It’s evident from the collected data that most of the brands are investing their marketing budget heavily in design, tools & software, and videos. There is a shift in advertising, as fewer brands are investing in stock photos and instead opting for more authentic visuals. This could be due to the increasing popularity of user-generated content, which is seen as more trustworthy and relatable than polished, professional images. Additionally, authenticity is becoming increasingly important to consumers, who are bombarded with marketing messages daily. As such, they are more likely to respond positively to genuine and personal content.
What are the biggest struggles faced by brands in creating visual content?
There are a few challenges that brands face when creating visual content. Firstly, they need to ensure that the quality of the visuals is high enough to captivate and engage the audience. Secondly, they need to make sure that the visuals are relevant to the brand and support the message that they are trying to communicate. Lastly, they need to find ways to stand out from the competition and create unique and original content that will grab attention.

Conclusion – Most brands find it challenging to produce visual content on a regular basis. This is because creating quality visuals requires time, effort, and skill. Additionally, it can take time to come up with new and exciting ideas for visuals that will appeal to their target audience. However, producing visual content regularly is essential for staying relevant and engaging with your audience. Therefore, brands need to find ways to overcome these challenges and continue to produce quality visual content on a regular basis.
Best Performing Channels for Visual Content Marketing!
There are a variety of channels that can be used for visual content marketing. Some of the most effective channels include social media platforms, such as Instagram and Pinterest, and video-sharing websites, such as YouTube. Additionally, using infographics and images on a brand’s website can also help drive traffic and engagement. When selecting the best channels for visual content marketing strategy, it is crucial to consider the target audience and which platforms they are most active on.

Youtube
66% of marketers voted it as the best channel.

61% of marketers voted it as the best channel.

56% of marketers voted it as the best channel.

Brand’s website
43% of marketers voted it as the best channel.

Tiktok
29% of marketers voted it as the best channel.

29% of marketers voted it as the best channel.

Television
18% of marketers voted it as the best channel.

8% of marketers voted it as the best channel.
Conclusion – Admittedly, Youtube, Facebook and Instagram are the clear winners as the best-performing channels for visual content marketing. Further, almost half of the marketers also believe that their brand’s websites are one of the best channels for visual content marketing. Television and Pinterest got the least vote of confidence from the marketers as the best-performing visual content channels.
About Infobrandz’s “The state of visual marketing in 2023” report:
We delve deeply into visual content as we have helped countless brands to establish themselves on the web through creative visual content. For this report, we have communicated with 378 digital marketers across different business verticals and interviewed them. We asked these fundamental questions regarding how they employ visual content in their overall marketing endeavours. We collected data from them, compiled these data sets, and came up with this report. Every interview was done through electronic communication channels. This report can help other marketers looking to get clear ideas regarding visual content marketing and the effect of the same in enhancing their marketing ROIs.
Vidico was tasked by Vervoe to produce a gripping video on the state of hiring. An amazing product and a humorous take on office life, resulted in a stunning 89% completion rate on average.

Explainer Video

Brand Video

Overview Video